We love the F-Score here at Stockopedia - it's published on every Stock Report and a key metric in our screener. Why do we love it so much? Firstly, it's massively well researched, backtested and documented. Secondly, it's very easy to understand (as a number between zero and nine), providing a quick way to assess a company's fundamental momentum. Thirdly, it illustrates persistent 'alpha' year in year out. How much do portfolios built on the F-Score outperform? SocGen found that High F-Scoring stocks outperform low F-Scoring stocks by up to 14% per year in aggregate in 4 out of every 5 years. But we've found this year that spread between expensive low F-Scoring stocks and cheap high F-scoring stocks has been over 50%.
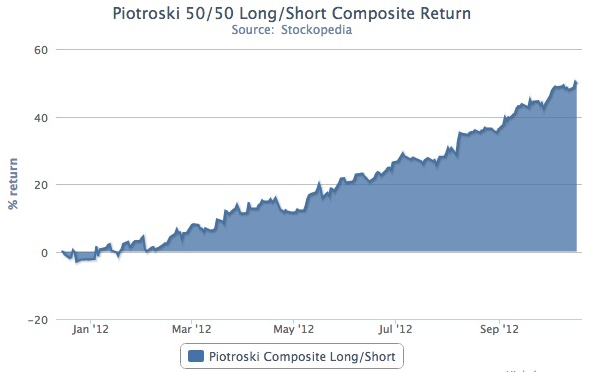
Just to illustrate this, I thought I'd share this graphic that we put together. It shows the average 'long' Piotroski screen on the Stockopedia website minus the average 'short' Piotroski screen. I've been pretty astounded by the results of this exercise - however theoretical. Considering how volatilile the market has been this year... this 'market neutral' portfolio has provided an exceptionally low volatility return.
If you want to learn about the F-Score try this article that I wrote earlier this year - and there's bags of resources about it on the website - try a quick search here - or you can access all the piotroski screens in the screener here.


