When to sell adventurous growth (QM) stocks

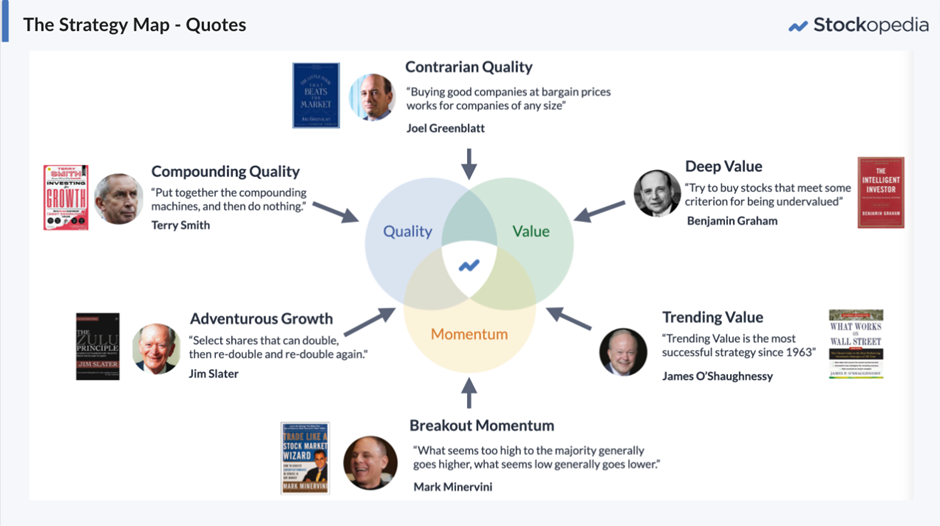
This week, Megan has been looking at Adventurous Growth strategies, which are stocks on the Stockopedia Style Map that are high quality and have high momentum:
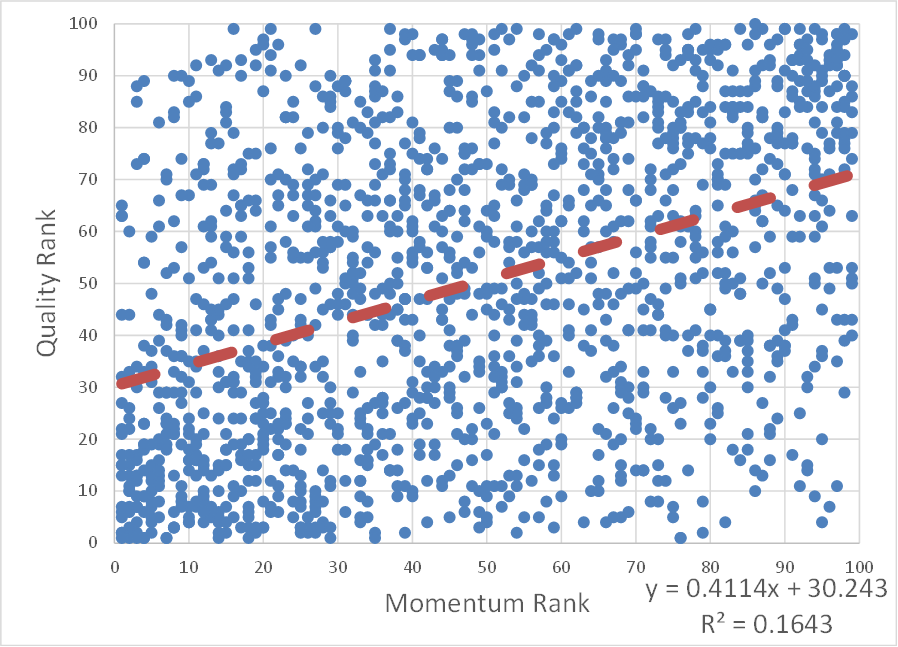
We know that the Quality and Momentum Rank are positively correlated due to the inclusion of measures of earnings momentum in both measures:
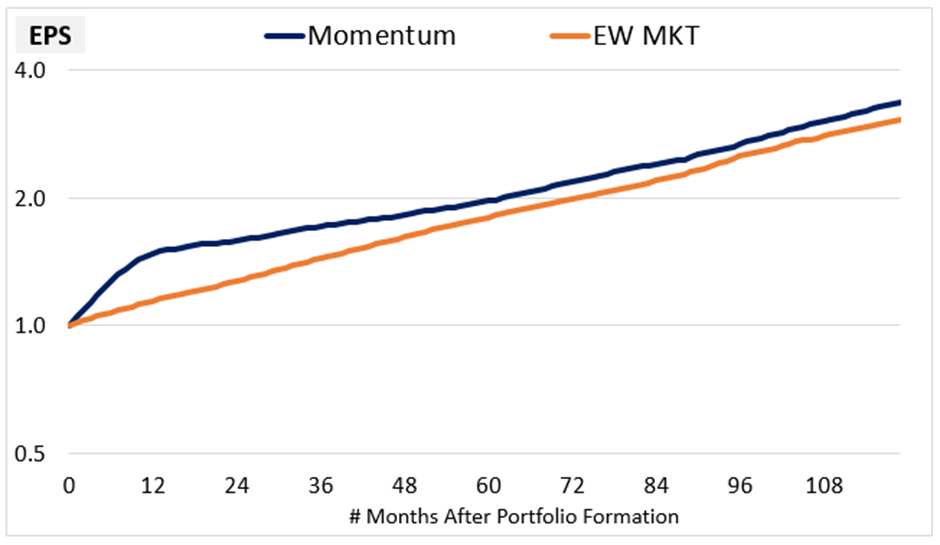
However, in many ways, they are very different strategies. Quality strategies require patience as better companies compound their re-invested capital. Whereas, Momentum is short-lived and requires regular rebalancing into recent winners, as this chart from one of my favourite studies (Factors from Scratch) shows:
So, the big question is when should an investor sell a QM stock? Should they sell quickly as momentum fades, or can they hold for the long term and minimise trading costs and other frictions? I set about trying to find the answer with some data.
Methodology
Starting with the 30 highest-ranked QM stocks at the end of each year, 2014-2021, I looked at how these stocks performed over the subsequent time periods. For example, these are the 30 highest QM-Ranked stocks on 30 December 2014:
Character (LON:CCT) Zytronic (LON:ZYT) 4imprint (LON:FOUR) Jet2 (LON:JET2) Atlantic Lithium (LON:ALL) Advanced Medical Solutions (LON:AMS) Avon Protection (LON:AVON) James Latham (LON:LTHM) Animalcare (LON:ANCR) City of London Investment (LON:CLIG) £RM Benchmark Holdings (LON:BMK) Idox (LON:IDOX) Portmeirion (LON:PMP) FD Technologies (LON:FDP) Solid State (LON:SOLI) Hill & Smith (LON:HILS) FDM (Holdings) (LON:FDM) K3 Business Technology (LON:KBT) CVS (LON:CVSG) Safestyle UK (LON:SFE) Costain (LON:COST) Gooch & Housego (LON:GHH) Mattioli Woods (LON:MTW) Liontrust Asset Management (LON:LIO) Churchill China (LON:CHH) CML Microsystems (LON:CML) YouGov (LON:YOU) Tracsis (LON:TRCS) Impellam (LON:IPEL)
Since the Stockopedia data began in 2014, I couldn’t go any further back, but it means we have one 8-yr period, two 7-yr periods, …., and eight 1-yr periods of performance to study. I then looked at the average cumulative outperformance of these sets of 30 QM stocks based on prices from Google Finance.
Results
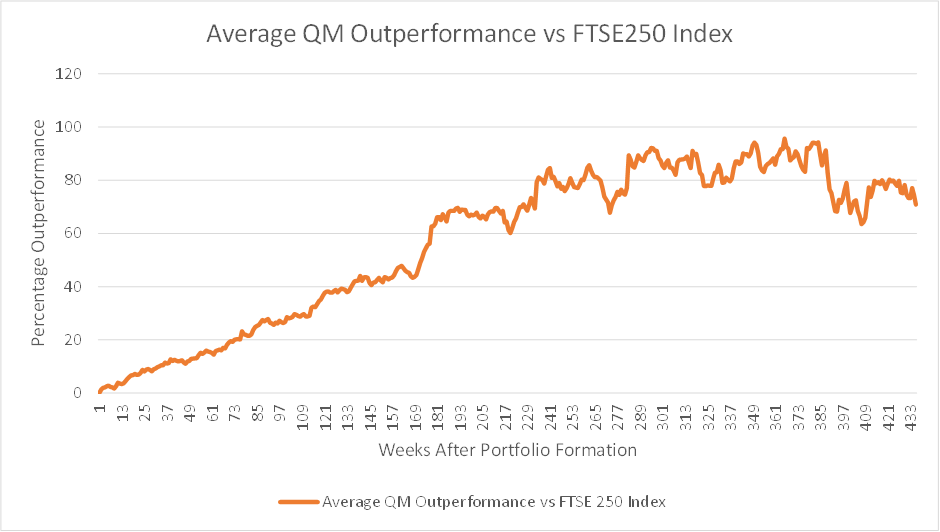
Here is the key finding:
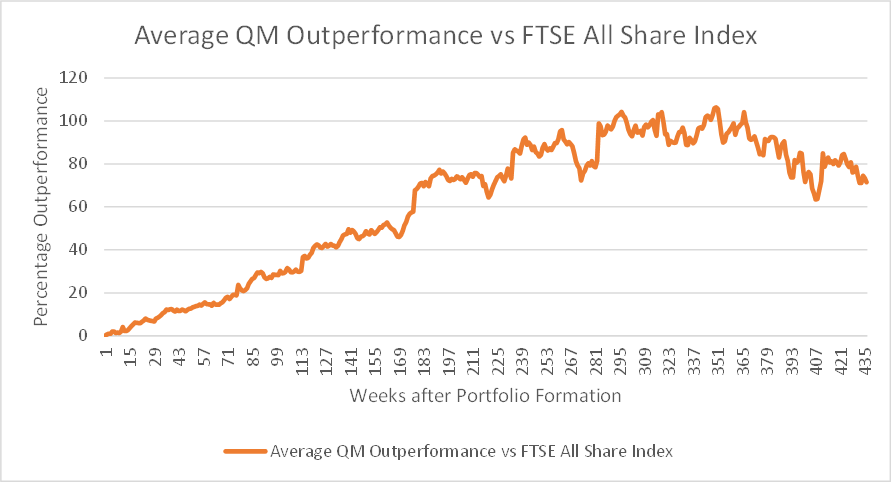
Although the data for later years is limited, the pattern is quite clear: on average, a QM strategy outperforms for several years, perhaps up to 3-4. However, these picks tend to perform in line with the market or even underperform after this period. While the high momentum helps in the short-term, mean reversion starts to kick in after a few years.
No index is a perfect comparison, and it may be the case that the dominance of larger stocks in the FTSE All Share is having an effect. However, this is unlikely to be the case as the same analysis versus the FTSE250 shows a very similar picture:
Looking at these charts, it is tempting to think that investors should hold a portfolio of QM stocks for up to 5 years. However, this chart is a linear scale which means that the return going from 60% to 80% is 12.5% in portfolio value, whereas 0% to 20% is, of course, 20%. This is what the same chart looks like on a log scale:
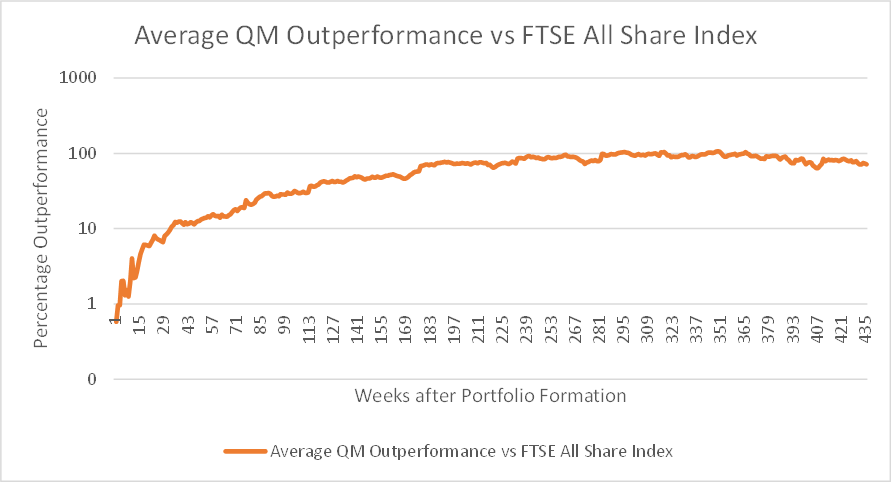
This suggests that investors wanting to maximise their returns will be better off rebalancing yearly or even earlier. However, returns will be more volatile with a higher rebalancing period.
However, it is not all plain sailing for a QM strategy. When I look at the individual years, there is considerable variation in performance:
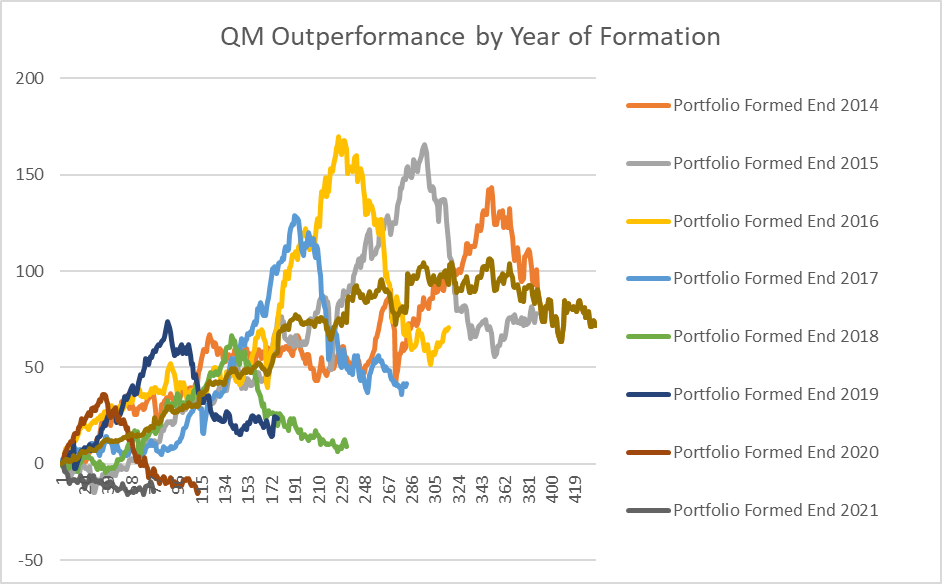
All of the portfolios show significant mean reversion effects kicking in. The point in time when the QM portfolio starts to underperform is almost the same for each portfolio – towards the end of 2021. The portfolio formed at the end of 2021 never even got going and has consistently underperformed:
This is the point where UK markets became quite volatile:
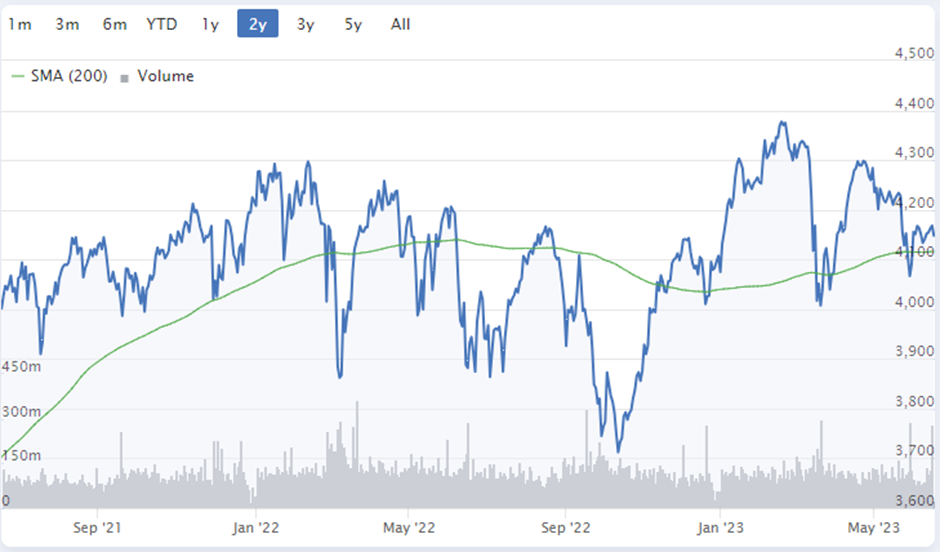
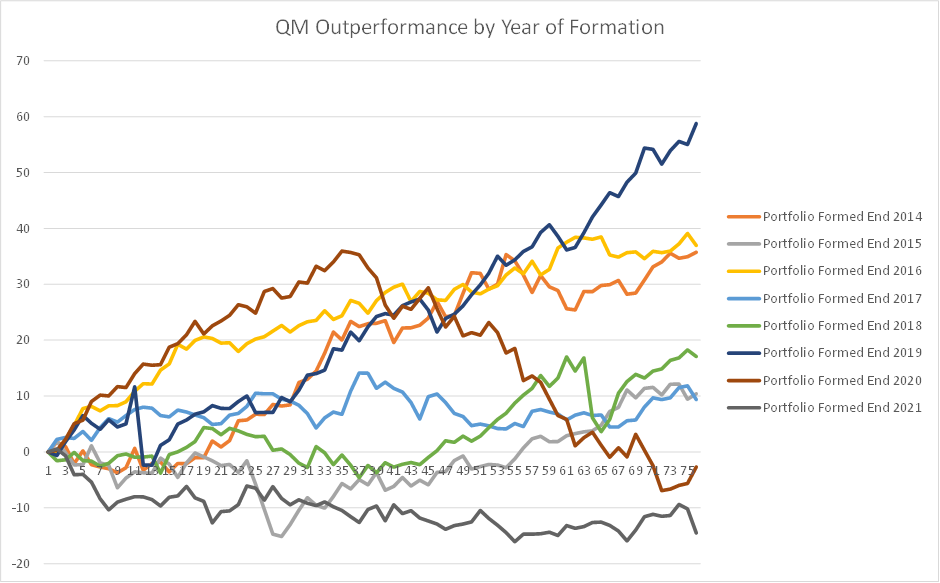
So potentially, a QM strategy requires a clear trending market to outperform, and investors should avoid the strategy until the market direction is clearer.
The chart also suggests that another strategy could be applied. An investor could review the QM portfolio after six months and see if it has underperformed. If it has, they should bail. If it has outperformed, they should stick with it for another six to twelve months before re-forming a new high-QM portfolio.
Limitations
Just to be clear, there are a few limitations to this analysis:
- It excludes stocks that have been delisted, such as due to a takeover, since google finance doesn’t have the required data.
- Eight portfolios may not be statistically significant.
- The analysis doesn’t look at other selling options apart from after a set period. For example, selling when the Momentum rank drops may improve performance.
- Dividends are not included. This is the same for both the index and QM portfolios and is unlikely to make a big difference in the short term. However, over longer periods, the results may differ from the returns investors would have received.
I don't expect these to significantly alter the findings, though.
How many stocks should a QM investor own?
I was intrigued by the following research released recently by Verdad Capital, which asked how few stocks investors could own. Here is the key chart:
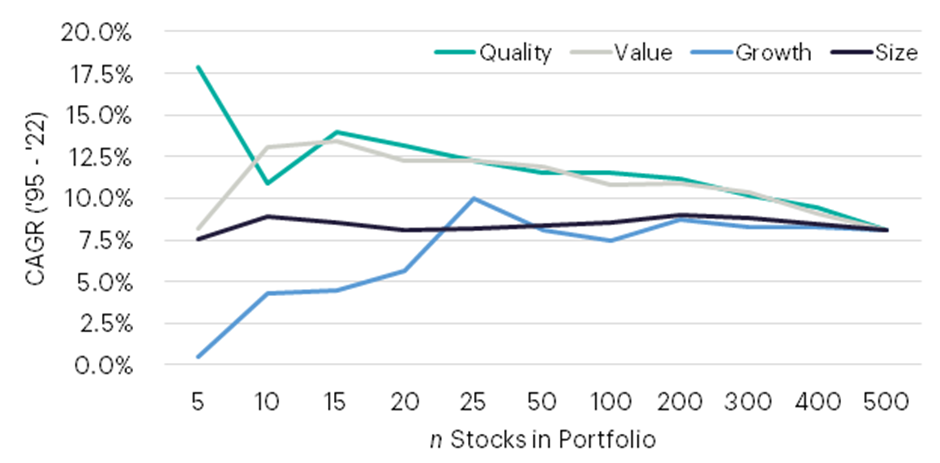
The research concluded:
The optimal relative Sharpe is still achieved at 200–300 stocks, but here the excess CAGR is significantly reduced relative to a more concentrated portfolio. We believe the sweet spot for excess returns in large caps, balancing the elimination of truly wild volatility, seems to be achieved at 15–20 stocks.
Which was based on the following data:
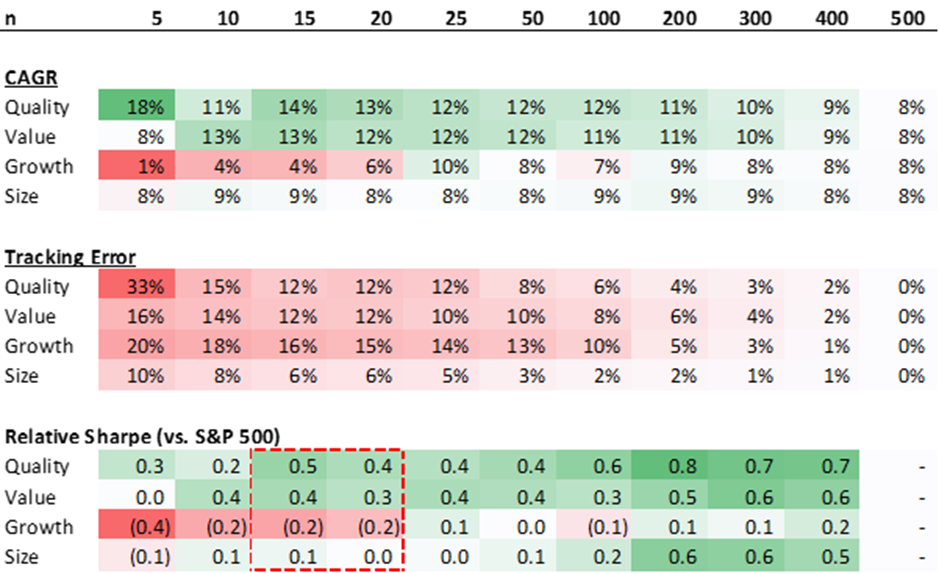
I think they may have underestimated the ability of investors to cope with downside volatility, but I largely agree with the thrust of their argument. I wanted to see if QM stocks have similar properties and if this can provide some guidance on the optimal number of QM stocks to own.
Even the Top 30 QM stocks have a QM Rank of 97 or higher, but I wondered if the highest of high QM Ranks stocks performed even better. Here is the average outperformance of the different-sized QM portfolios versus the FTSE All Share for the two years after portfolio formation:
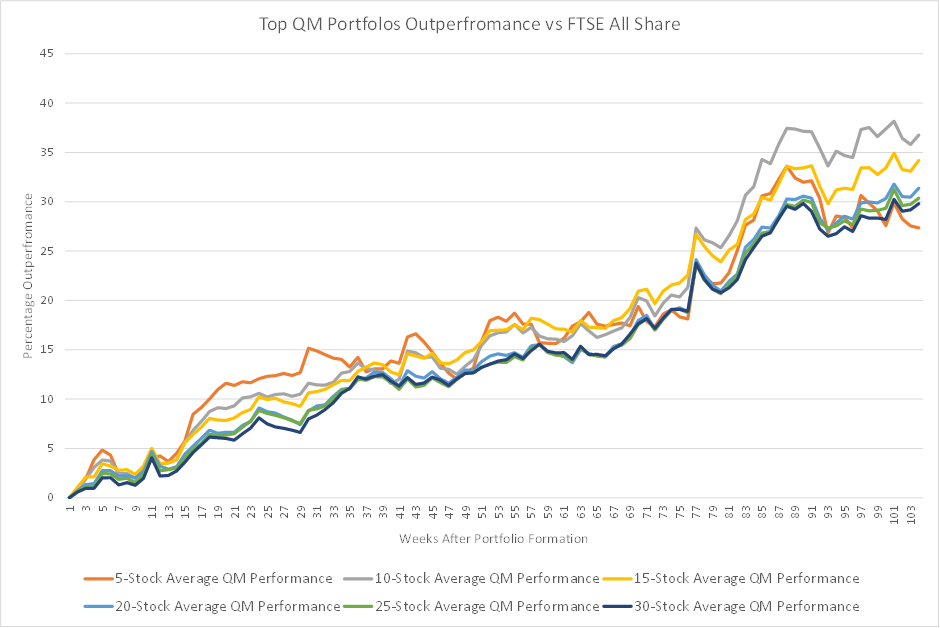
As expected, a 5-Stock portfolio is more volatile. However, investors are not receiving any clear performance advantage from this, which suggests QM investors should not be this concentrated. The other factor to consider is the maximum underperformance an investor would see during these two years. Here, 5-Stock investors face very considerable periods of underperformance:
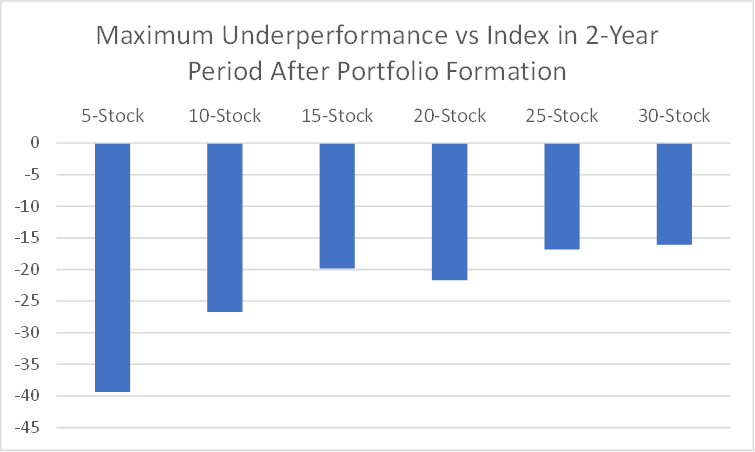
Again, eight portfolios are a limited data set, and investors should expect worse than this in future market conditions. However, this suggests that the more adventurous QM investor could get away with the top 15 QM stocks without significantly increasing downside risk. Although it is not clear that fewer stocks will give higher returns, the benefits will be in lower frictional costs for a strategy that requires regular rebalancing.
Summary
Guided by these results, If it was my money, here is how I would play a QM strategy. Firstly, I would only follow it when market indices have clear trends. I would pick the highest-ranked 15-20 mid-cap and large-cap QM stocks in order to minimise my frictional costs of buying and selling. After six months, I would review the portfolio and sell all the stocks if the portfolio hadn't outperformed the market. Otherwise, I would hold for a further six to twelve months before selling and forming a new high QM portfolio.

About Mark Simpson
Value Investor
Author of Excellent Investing: How to Build a Winning Portfolio. A practical guide for investors who are looking to elevate their investment performance to the next level. Learn how to play to your strengths, overcome your weaknesses and build an optimal portfolio.
Disclaimer - This is not financial advice. Our content is intended to be used and must be used for information and education purposes only. Please read our disclaimer and terms and conditions to understand our obligations.
Ed ran a database query for me! Sorry, don’t think there is a generally available way to do it on the public site.

Very useful. Thanks, Mark.
You said about the strategy: "I would only follow it when market indices have clear trends." And that raises the intriguing possibility of switching between strategies according to market conditions -- rather than just waiting for a particular style to begin working again.
Is there any mileage in the idea of Stockopedia discussing in an article what strategies may be optimum for various market and economic conditions?
In the meantime, what strategy would you favour right now and why?
Thanks Mark but on the point of "After six months, I would review the portfolio and sell all the stocks if the portfolio hadn't outperformed the market. Otherwise, I would hold for a further six to twelve months before selling and forming a new high QM portfolio" - there is a risk of throwing the baby out with the bath water...would it not be best to evaluate each of the stocks in the portfolio and remove the weeds (and keep the flowers so to speak). I would agree with the point about market conditions being in your favour/trending (and I assume the momentum ranking has some basis on Relative strength which can be high even in a declining stock if the wider market is falling faster)
The interesting thing is that pretty much every factor strategy, Small, Q, V & M has struggled this year, making it a pretty unique investing time.
That could be an interesting article. Although perhaps a difficult one to research definitively.
In terms of investing now, UK vs the US and small and mid-caps vs large caps would seem to be the place to be, given the valuation differentials across these markets and sizes. This doesn't mean that these will immediately outperform, but with a 2-yr investing horizon, the odds are stacked in favour of UK small caps. Part of the reason is the scale of outflows recently, which are a contrarian indicator of high future returns. See https://www.stockopedia.com/co...
Momentum looks risky at the moment, certainly in UK stocks. See here: https://www.stockopedia.com/co...
However, this may just be wishful thinking as a mainly UK small cap value investor.
If you can come up with a consistent way of doing this, then that would be great. But it can be quite hard to tell the weeds from the flowers. For example, here is the performance of the underperforming End of 2021 QM portfolio after six months, plotted against the subsequent almost 1-year performance:
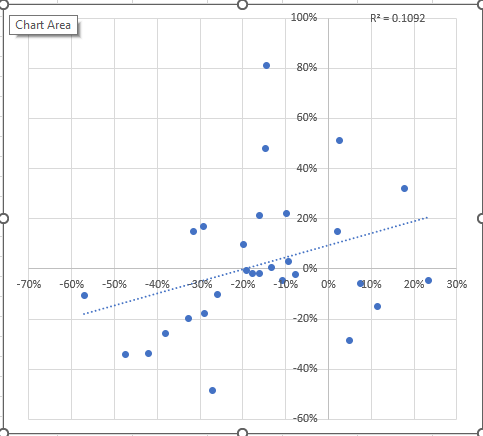
So the relationship is slightly positive but weak. And if you only held the winners from the first six months and sold the rest, you would be left with seven stocks, of which only three were subsequent winners. So not necessarily a great return. You'd need a lot more data to draw conclusions at the stock level rather portfolio level given the extra noise.

The interesting thing is that pretty much every factor strategy, Small, Q, V & M has struggled this year, making it a pretty unique investing time.
I don't think this is strictly true. The main factor that has failed is the small cap effect. If you use a capitalisation weighted index as your benchmark you may come to the conclusion that factors have all failed, but by comparing to the average share, quality, value, momentum and volatility have all been effective.
See this post Here


*Past performance is no indicator of future performance. Performance returns are based on hypothetical scenarios and do not represent an actual investment.
This site cannot substitute for professional investment advice or independent factual verification. To use Stockopedia, you must accept our Terms of Use, Privacy and Disclaimer & FSG. All services are provided by Stockopedia Ltd, United Kingdom (company number 06367267). For Australian users: Stockopedia Ltd, ABN 39 757 874 670 is a Corporate Authorised Representative of Daylight Financial Group Pty Ltd ABN 77 633 984 773, AFSL 521404.
Starting with the 30 highest-ranked QM stocks at the end of each year, 2014-2021, I looked at how these stocks performed over the subsequent time periods
How did you get these year end QM ranks?