Dear Investors,
DIY investors have been able to use the StockRanks for around ten years in order to see a stock’s exposure to the factors that drive price returns, namely Quality, Value and Momentum. Over those ten years, we have amassed a substantial archive of historical StockRank data. You’ll see this most notably on the StockReports. Under the price history, every stock has a chart that shows how the StockRank has changed over time.
After months of hard work and conversation with our data provider, we are delighted to announce that a full StockRank history is now available on the StockReports. Understanding the relationship between the StockRank and a stock's price can help you use the ranks more effectively when making investment decisions. You'll find some rules of thumb for this towards the end of the article.
See a full StockRank history on all stocks
Until now, a minority of StockReports displayed truncated StockRank histories due to complex corporate actions or ticker changes. This happened because our data provider, Refinitiv, assigned different identifiers (known as RICs) to securities before and after the corporate action. This did not affect all stocks, but it did affect a number of popular companies, including Sanderson Design and Reach on the London Stock Exchange.
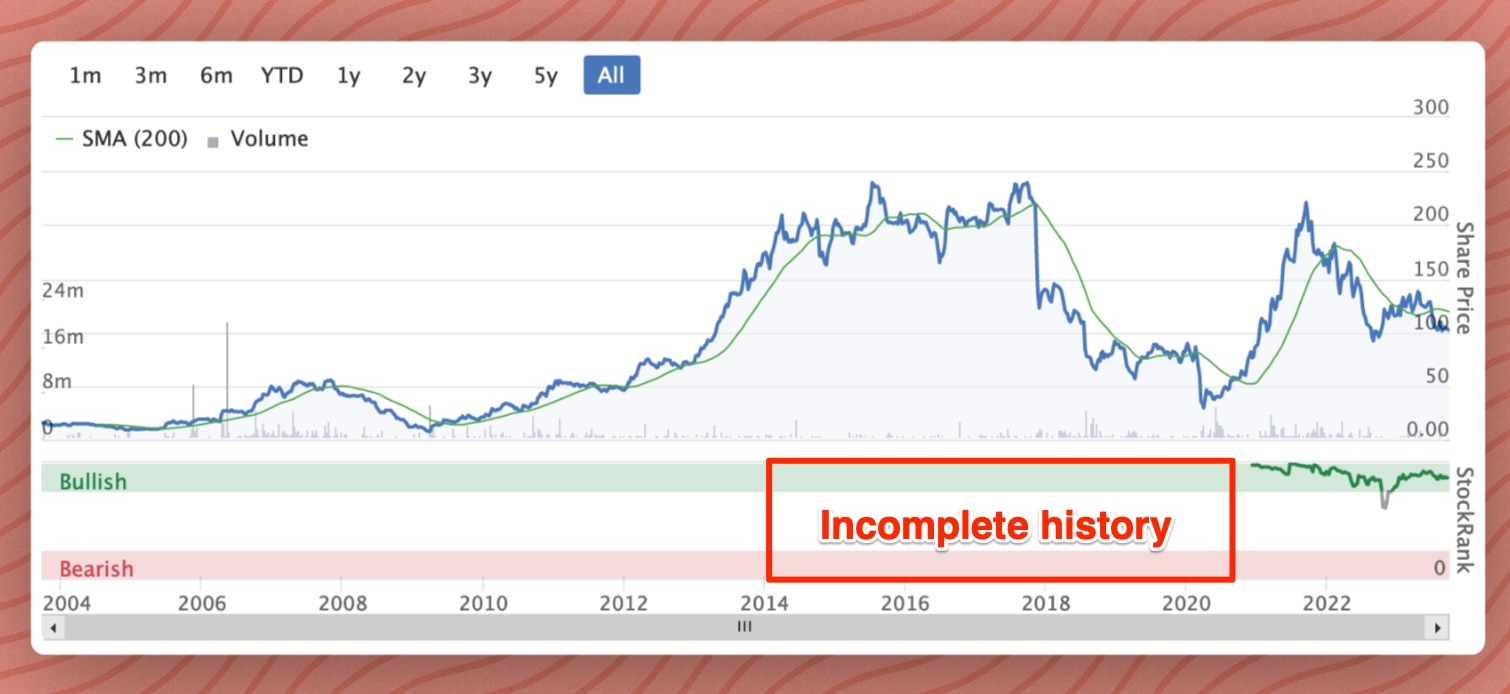
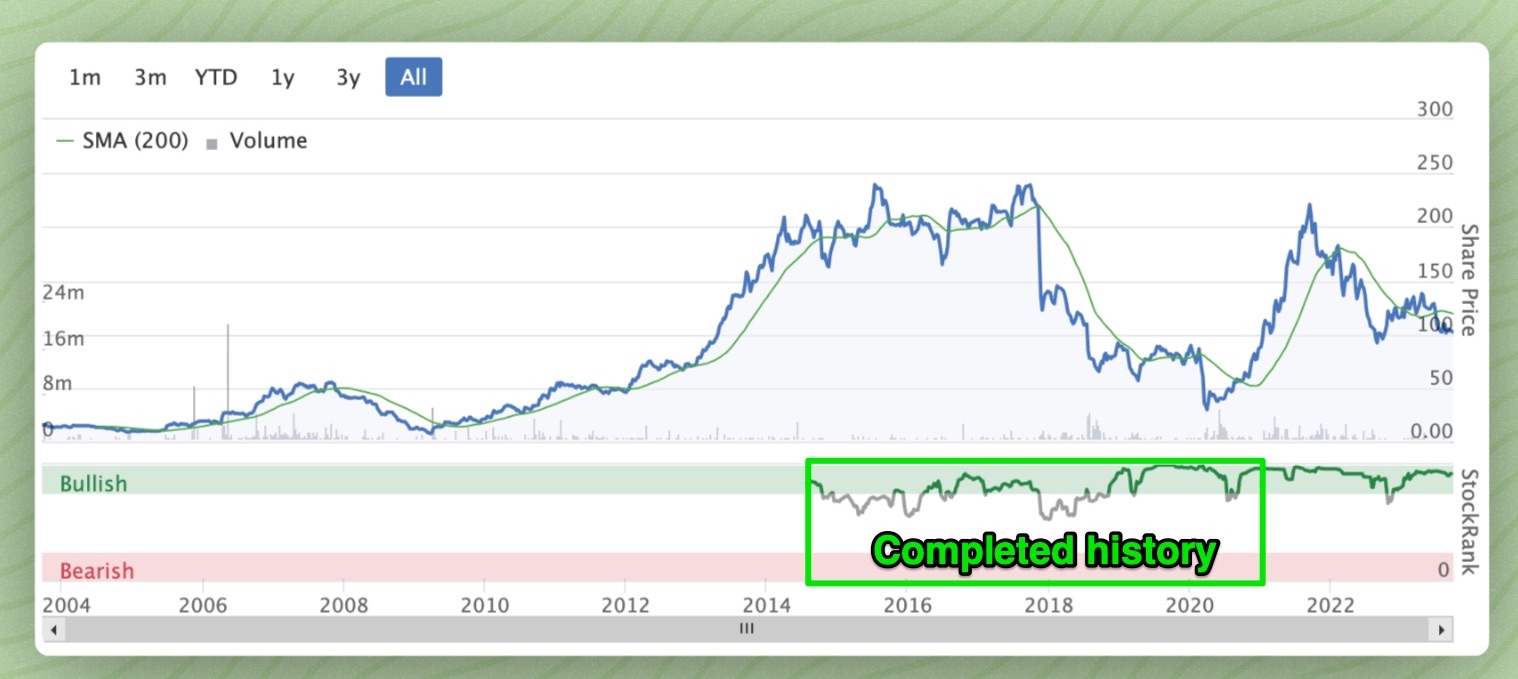
Following discussions with Stockopedia analysts, Refinitiv now provide a constant identifier for each stock that remains the same, even if the ticker changes. We have adapted our data processes to take advantage of this, meaning that you can see the StockRank history going back to 2014.
What does this mean for you?
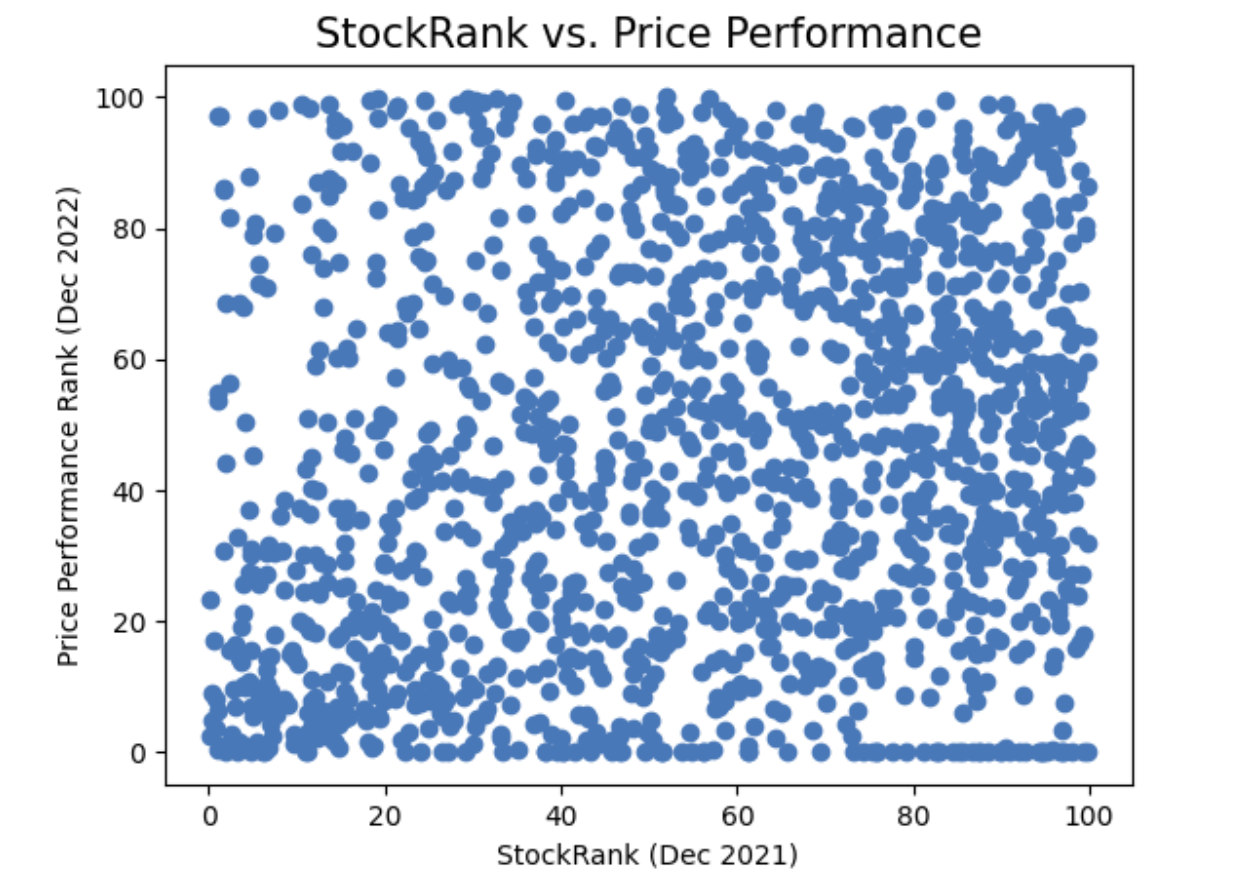
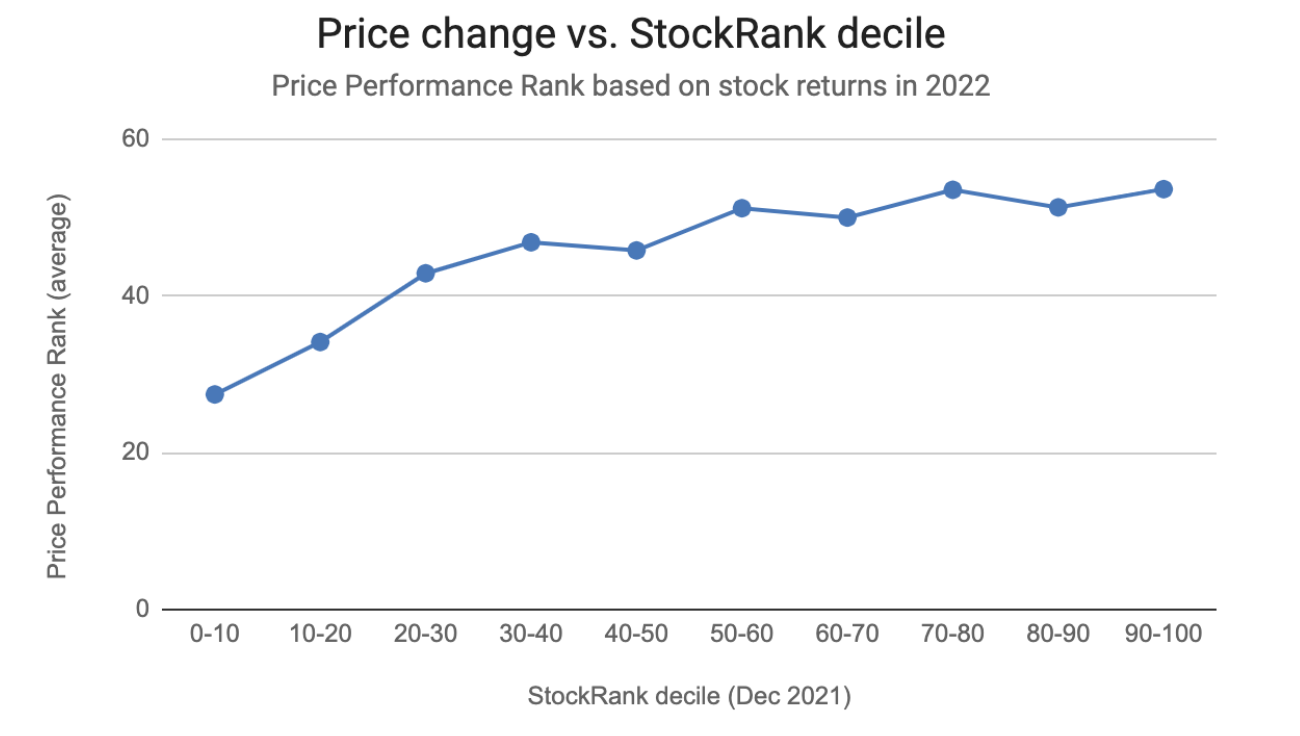
This latest improvement provides a more nuanced insight into the relationship between a StockRank and a stock’s price movement. While this relationship is of course unique for every stock, higher-ranked stocks have historically had a higher probability of outperformance over time. This phenomenon is most reliably captured by an approach like the NAPS, which is agnostic to the individual stocks selected by the system. However, there are some rules of thumb that may help those who prefer bottom-up stock picking to take advantage of the StockRanks to tip the odds in your favour.
For those seeking a very hands-off approach to buy and sell timing, Ed has spoken in the past about the very simple “90/70 Rule” (explained in the…