The StockRanks are one of the most popular research tools on the site. Since their launch in 2013, subscribers have repeatedly told us how much they’ve helped them make faster and better-informed decisions with less need to crunch the data themselves.
With ten years of published StockRanks history, we decided it was time to review their history and deliver a range of improved educational resources to help you make the most of them. We have conducted an extensive research study, written a 30,000 word ebook, and intend to deliver a range of video tutorials and masterclasses.
As part of the research process, our data and engineering team implemented some significant improvements to the comprehensiveness of our archive prices data, upon which the return tracking of the StockRanks rests. These improvements have been shipped and are discussed in depth here.
Improving the quality of data
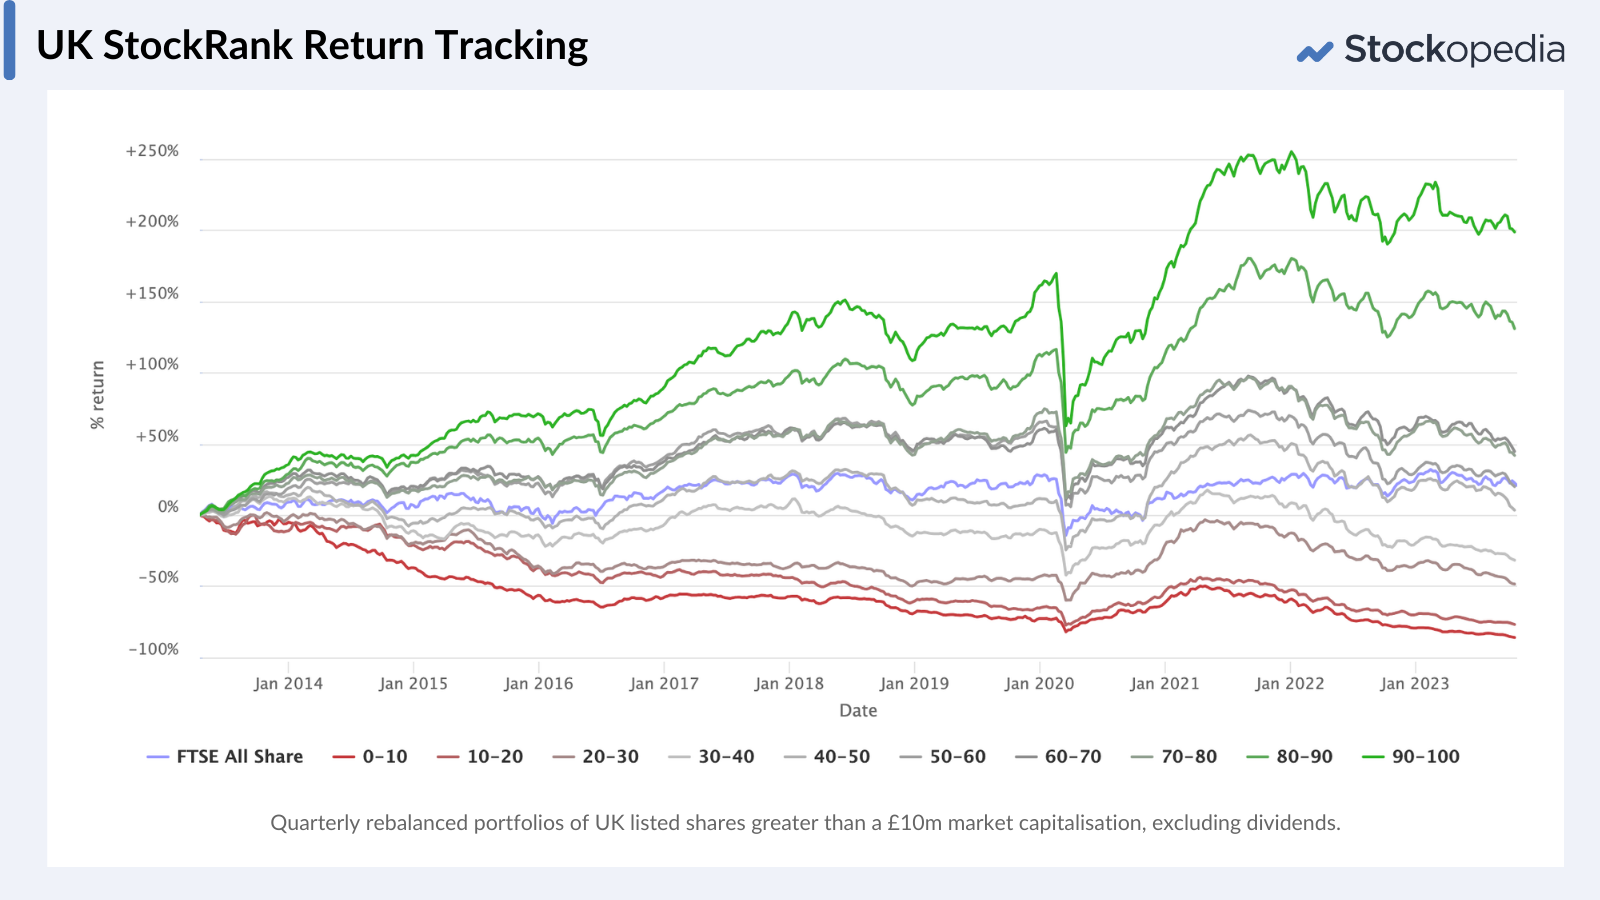
Since introducing the StockRanks, we've archived the data we publish for every share daily. The Learn → StockRanks section showcases the return history of shares across various deciles of ranking. Over many years, this data has affirmed the dominance of higher-ranked shares over lower-ranked ones in most markets around the world.
As we researched the data history, we identified a proportion of delisted stocks from the earlier years whose price histories had become unavailable. Our data and engineering team worked with our data providers, the London Stock Exchange / Refinitiv, to access and recover the price data for those shares and ensure completeness. As part of this project, we also improved the symbol mapping of shares that had undergone complex corporate actions.
With this data work now complete, you can benefit from:
- Improved Return Tracking: The recovery of the missing prices improves the accuracy of the return tracking of the StockRanks across all regions.
- Enhanced Data: The symbology and prices databases are improved across all regions, from North America through Europe to Asia and Australasia. We have aimed to make this data as survivorship free as possible. This is a solid foundation for new features based on this data in future.
- Complete StockRank Histories: Two weeks ago we released the first wave of this work, which ensured the StockRanks charts on StockReports were complete for shares where symbology changes due to complex corporate actions had interrupted the time series.
- Upcoming Educational Material: Our stream of upcoming educational materials includes studies of the “hit rates” of the StockRanks in picking winners, as well as many other statistical insights. These publications will rest on the foundations of this solid data work to give you the best insights possible.
Regional Insights
You can explore the return studies in the Learn section at your own leisure, but we wish to highlight a few differences here:
UK (2013 →)
Recovering these prices has generally marked the tracked returns downwards. The chart below shows the annualised return difference before and after these changes are introduced. The overall trend of low-ranking stocks underperforming and high-ranking stocks outperforming still stands, while the spread between the two is accentuated.
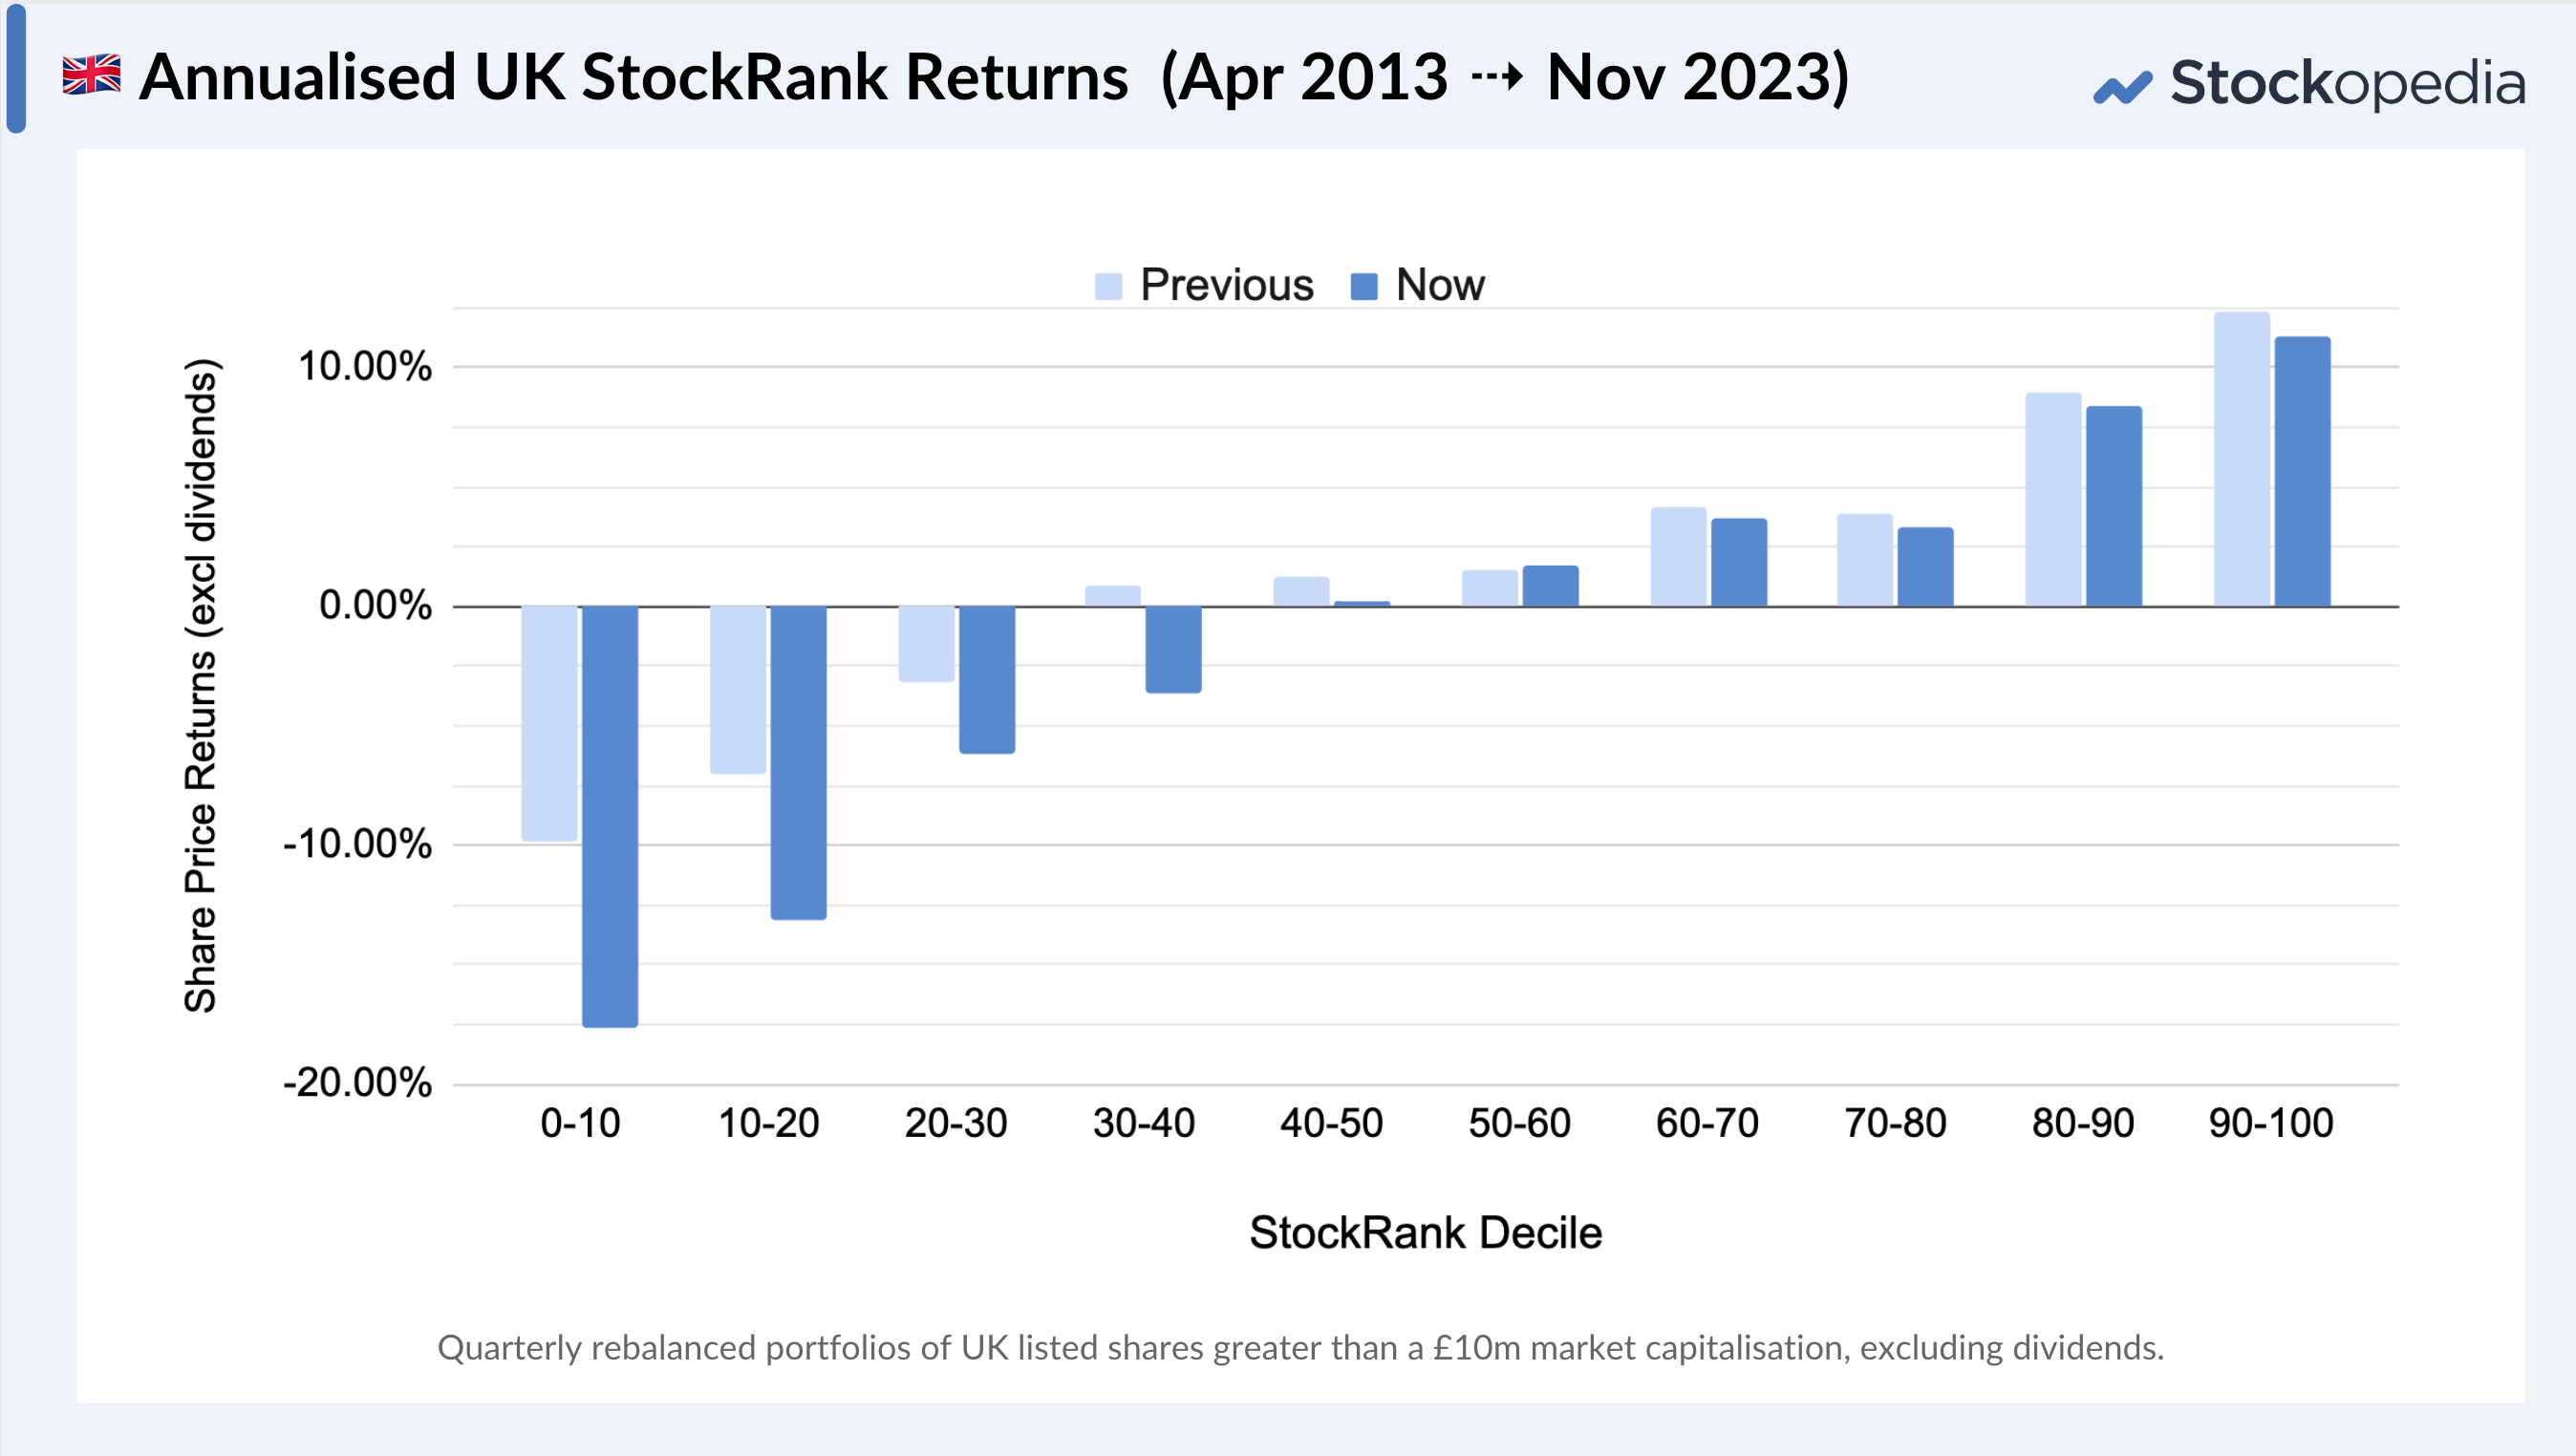
Since inception in 2013, the returns of the 90-100 StockRank set (on a quarterly rebalanced basis) were 12.3% annualised before recovering the missing data, versus 11.2% after. The impact of incorporating the missing delisted prices is felt keenly among low-ranking stocks. It is notable that the returns of lowest 0-10 StockRank set have dropped from -10% annualised to -17.6% annualised.
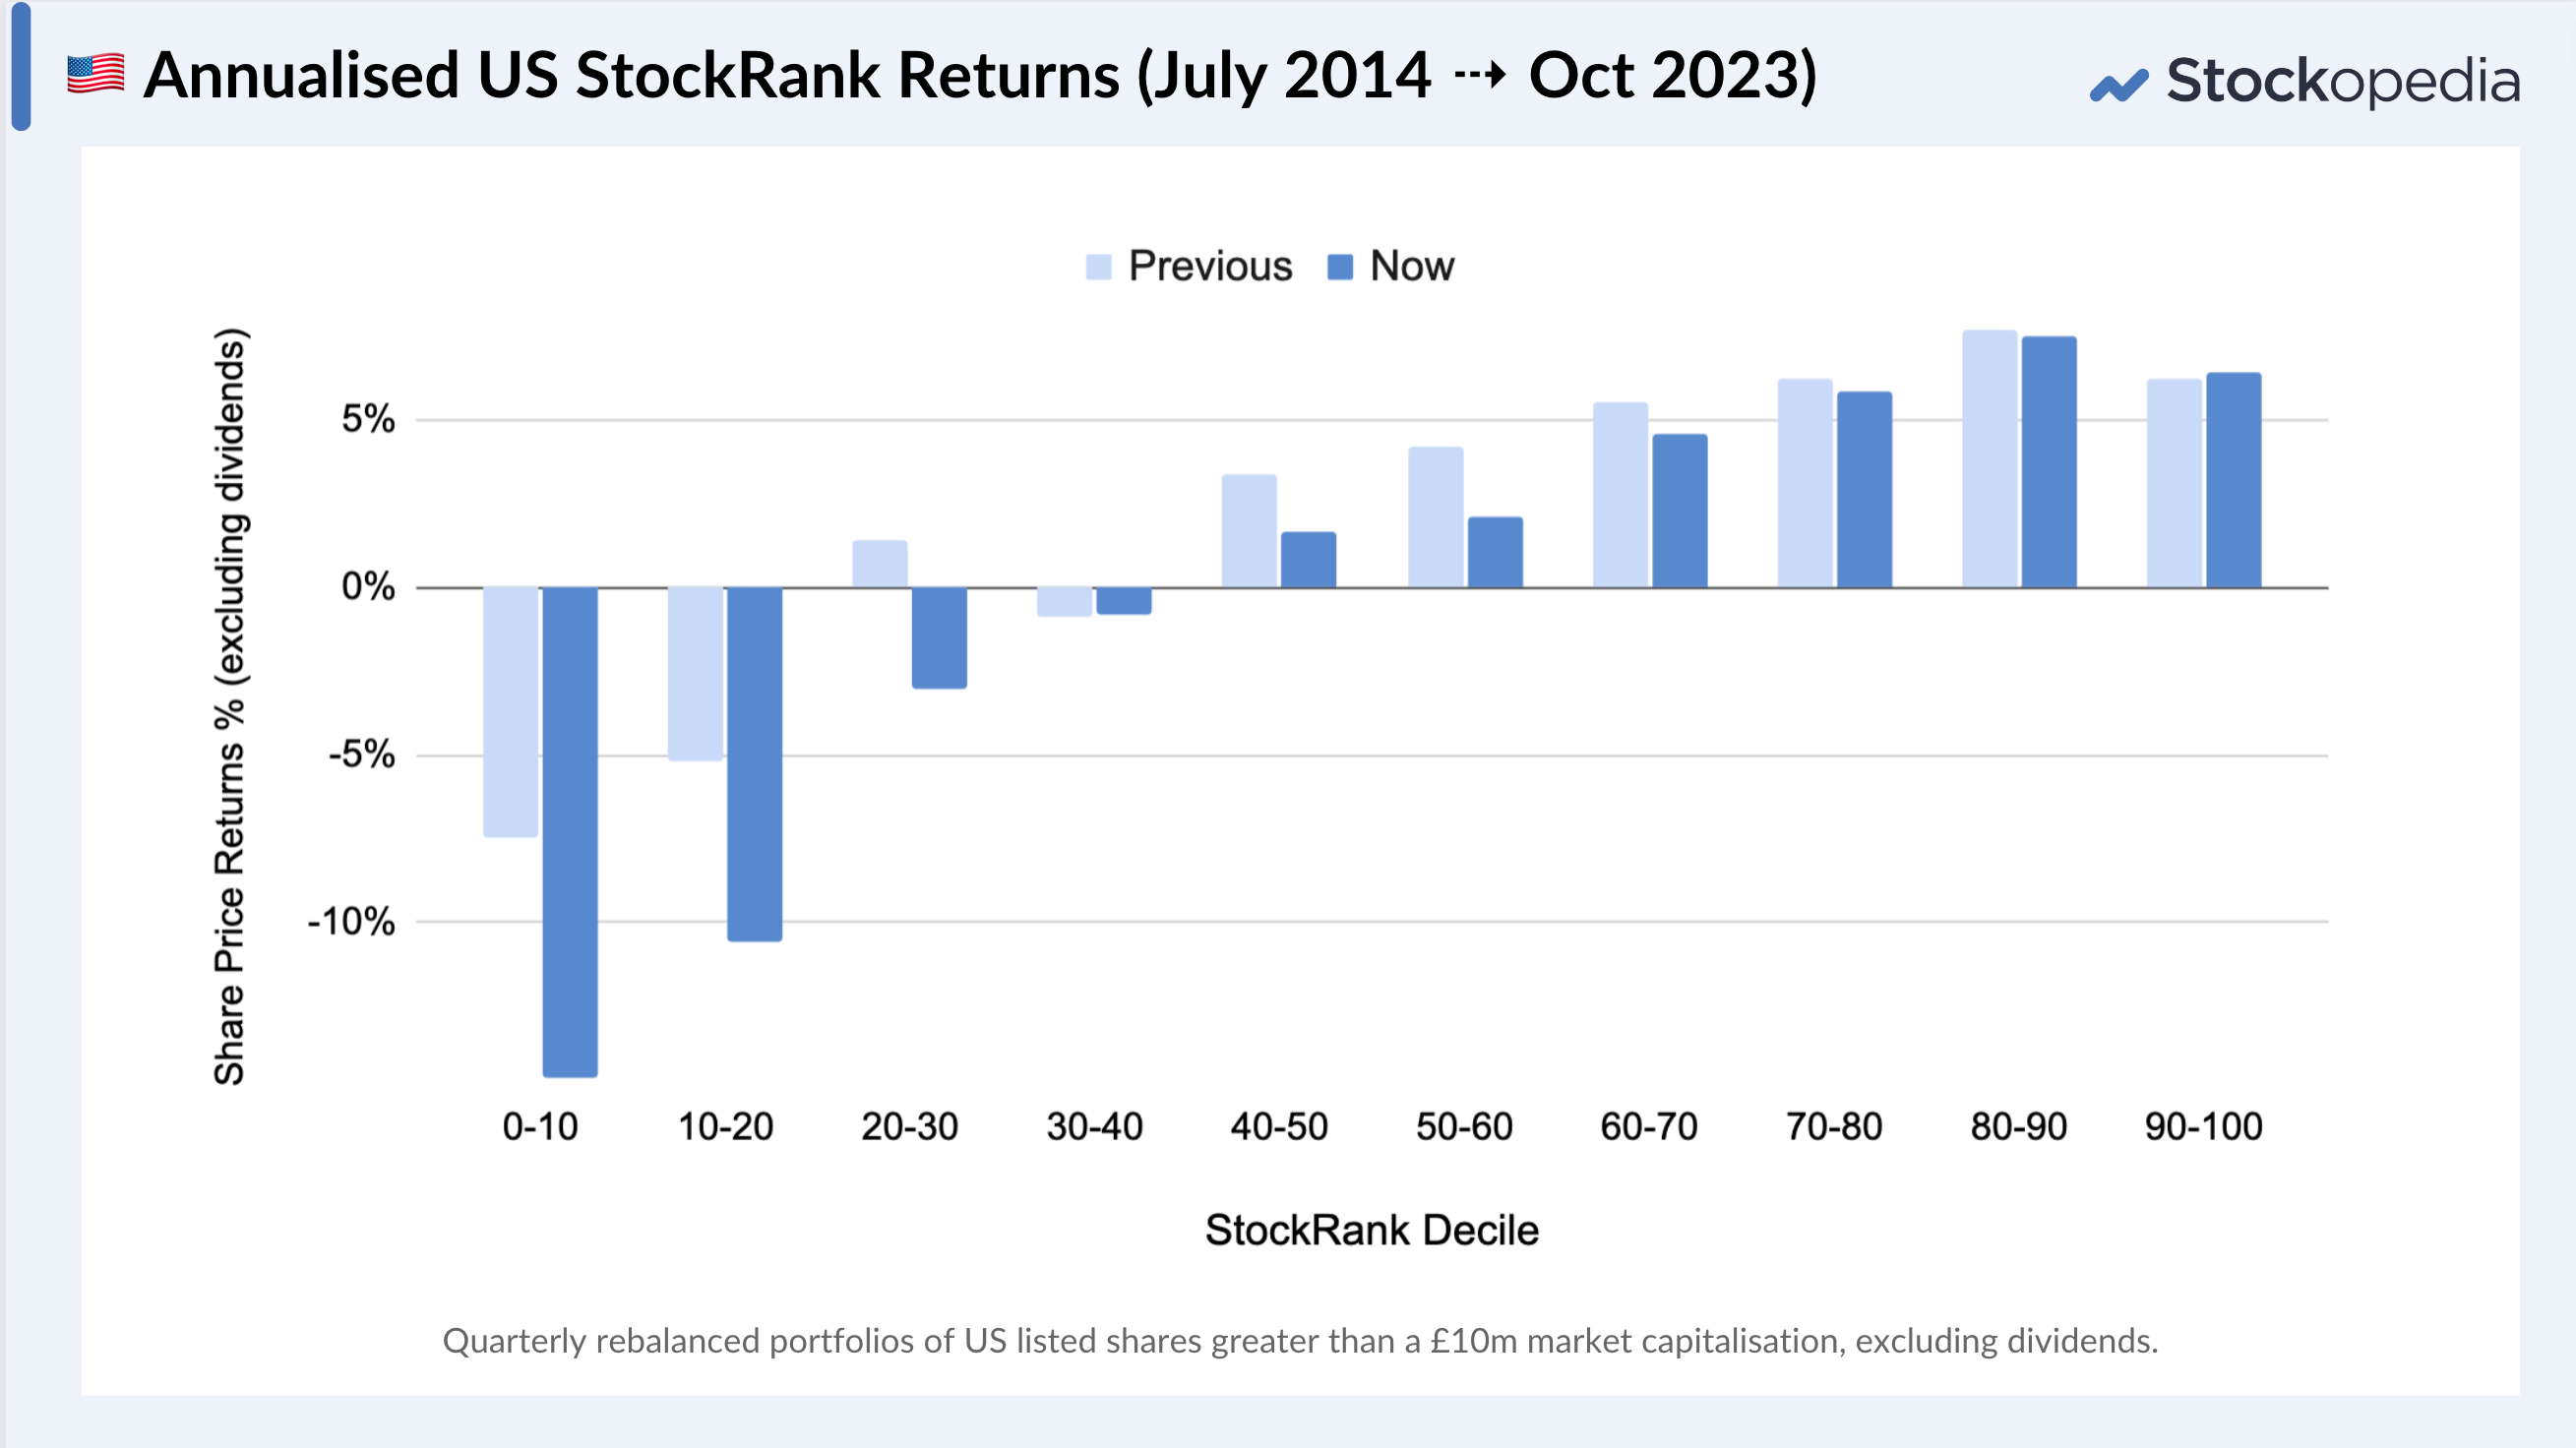
USA (2014 →)
Interestingly, in the USA, where we have one year’s less published data, there is a marginal improvement in the return tracking of the 90+ ranked set, but a decrease in performance of most sets. Again, this is most prominent among low-ranking shares. The “spread” between high and low-ranking shares is more significant than previously registered and more uniform across the ranking buckets.
Many have said that factor investing does not “work” in the USA, but these studies illustrate otherwise. Interestingly, while the high StockRank sets still underperform the market-cap weighted S&P 500 due to the dominance of mega-caps recently, they match or outperform equal-weighted American indices. We’ll be following up editorially on this in due course.
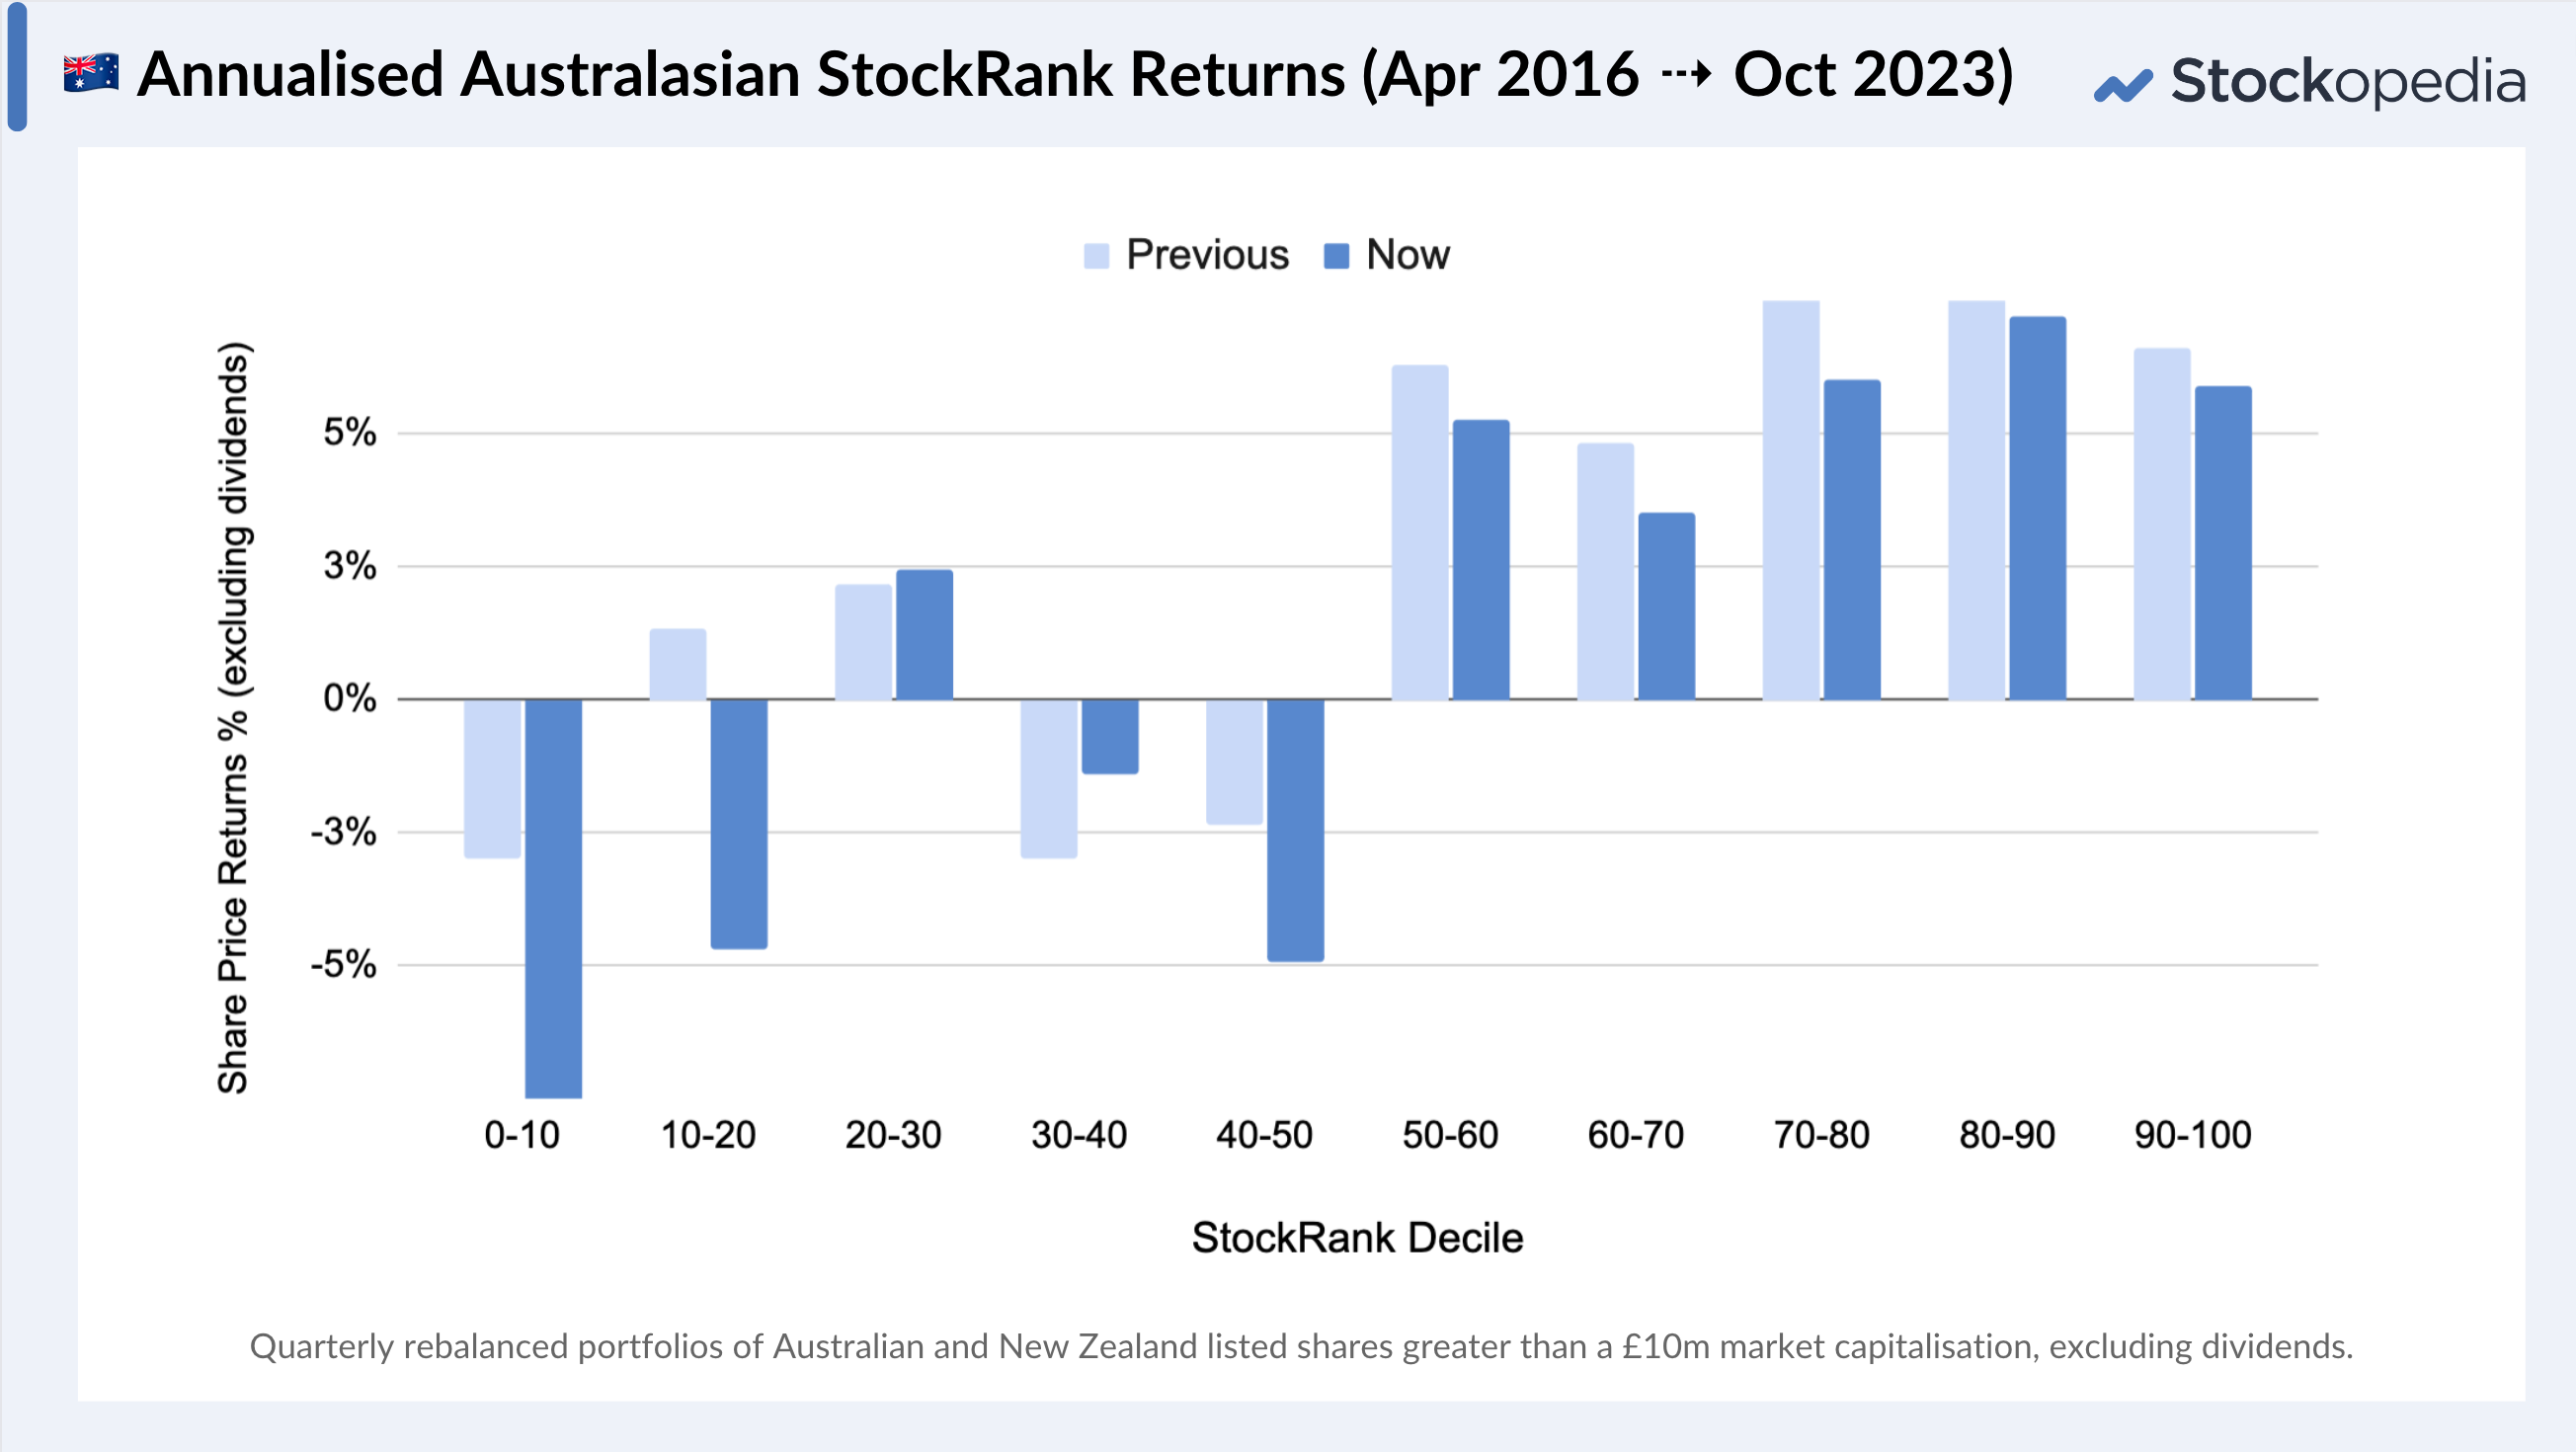
Australia & New Zealand (2016 →)
We have less history in Australian and New Zealand as the service only began covering the regions in 2016, so the decile “spread” is less mature, but the overall theme remains the same. The impact of the improved data is felt especially among lower ranked shares.
Final note
The StockRanks are a core part of our mission to make data-informed investment decisions easier for all of us as DIY stock market investors. These improvements in the underlying data quality continue to demonstrate the StockRanks as a powerful and robust tool for assessing shares. We will soon start publishing the range of educational resources we’ve been working on to help you make the most of these features.
As ever, if you do have any suggestions for future feature improvements, please do get in touch via the green support button. The team do log every single request and every vote counts.